

Image Details
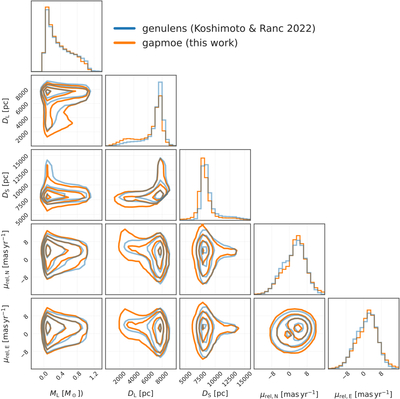
Caption: Figure 3.
Comparison between the direct samples drawn from genulens and those resampled from the density approximation computed by gapmoe. The corner plot shows the marginalized distributions of ML, DL, DS, and μrel.
Other Images in This Article
Copyright and Terms & Conditions
© 2026. The Author(s). Published by the American Astronomical Society.

Copyright ©
2026 Astronomy Image Explorer. All Rights Reserved.
