

Image Details
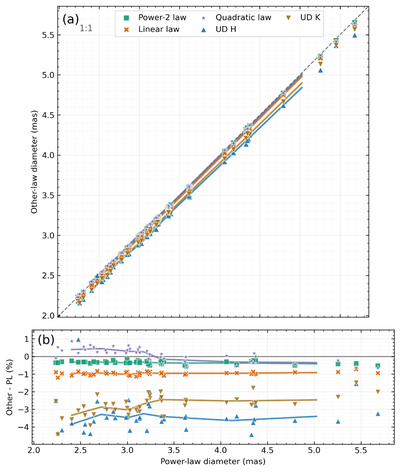
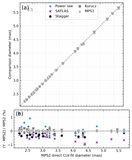
Caption: Figure 9.
Angular diameters from the power-law fit compared with other laws. Panel (a) shows diameter from other fitting methods (θother) vs. θPL; the black dashed diagonal is the one-to-one relation θother = θPL. Panel (b) shows the fractional difference, (θother − θPL)/θPL, in percent. The colored solid curves in panel (b) are running-median trends for each law, computed from the same point sets shown in panel (a). Power–2 and quadratic diameters remain closest to θPL, typically within 0.5%. The quadratic law often gives higher χ2 when fewer than two visibility nulls are sampled, reflecting parameter degeneracy. Linear-law and uniform-disk diameters are smaller because they underrepresent or ignore limb-darkening curvature, with the largest uniform-disk offsets in H.
Other Images in This Article
Show More
Copyright and Terms & Conditions
© 2026. The Author(s). Published by the American Astronomical Society.

