

Image Details
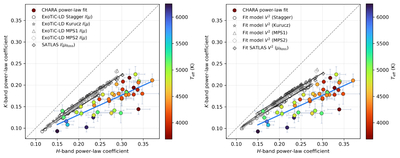
Caption: Figure 3.
Comparison of H- and K-band power-law coefficients from CHARA data and atmosphere-model predictions. The filled colored points show the empirical CHARA coefficients, (αH, αK), measured by fitting the CHARA V2 data and color-coded by Teff. The gray sequences show the corresponding model-grid predictions. Left: direct intensity-domain model coefficients, ﹩({\alpha }_{I,H}^{g},{\alpha }_{I,K}^{g})﹩, obtained by fitting the analytic law to the passband-integrated model intensity profiles Ib(μ) (Section 4.3). Right: SVAM coefficients, ﹩({\alpha }_{{\rm{SV\; AM}},H}^{g},{\alpha }_{{\rm{SV\; AM}},K}^{g})﹩, recovered by fitting the same law to synthetic CHARA-sampled visibilities generated from each model CLV (Section 4.4). The dashed line marks equality between the H- and K-band coefficients. The systematic separation between the colored CHARA and the gray model points shows the model–data discrepancy discussed in the text.
Other Images in This Article
Show More
Copyright and Terms & Conditions
© 2026. The Author(s). Published by the American Astronomical Society.

