

Image Details
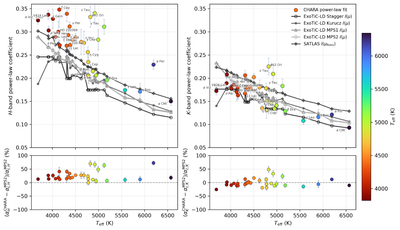
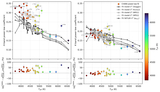
Caption: Figure 4.
CHARA power-law coefficients compared with intensity-domain coefficients predicted by the atmosphere-model grids. Top: H-band coefficients, αH and ﹩{\alpha }_{I,H}^{g}﹩, as a function of Teff (left), and K-band coefficients, αK and ﹩{\alpha }_{I,K}^{g}﹩, as a function of Teff (right). Filled colored circles show the empirical CHARA V2 fit coefficients, color-coded by Teff, while open symbols and gray curves show the corresponding model predictions from Stagger, Kurucz, MPS1, MPS2, and SATLAS. Bottom: fractional offsets of the empirical CHARA coefficients relative to the MPS2 intensity-domain predictions, shown as ﹩100({\alpha }_{b}-{\alpha }_{I,b}^{{\rm{MPS2}}})/{\alpha }_{I,b}^{{\rm{MPS2}}}﹩, with b ∈ {H, K} and CHARA 1σ error bars. Apparent discontinuities in some model tracks reflect edge-limited grid coverage for parts of the target sample. The limitations differ by grid: Stagger is limited for the coolest targets and some low-gravity/metal-rich stars, Kurucz and MPS1/MPS2 are mainly limited by their high-﹩\mathrm{log}g﹩ coverage for evolved stars, and SATLAS assumes solar composition (Table 3).
Other Images in This Article
Show More
Copyright and Terms & Conditions
© 2026. The Author(s). Published by the American Astronomical Society.

