

Image Details
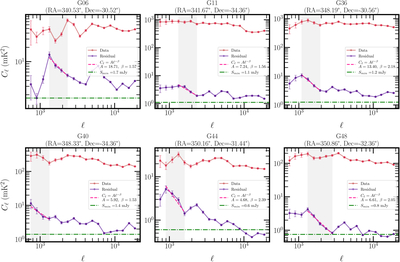
Caption: Figure 9.
Angular power spectrum (Cℓ) with 1σ error bars (in red and purple) plotted as a function of angular multipole (ℓ) for the visibility-based estimator (TGE; S. Choudhuri et al. 2014) at frequency 325 MHz for six target pointings at different latitudes of the GAMA-23 field. The vertical gray shadow indicates the range of ℓ values used to fit the power law, and the best-fitting model Cℓ = A(1000/ℓ)β is shown in magenta. The dashed dotted line (in green) represents the fitting prediction (i.e., Smin = 5σ; S. S. Ali et al. 2008). The values of magnitude A, power-law index β and ℓ range for APS are given in Table 5 for Band-3.
Other Images in This Article
Copyright and Terms & Conditions
© 2026. The Author(s). Published by the American Astronomical Society.

