

Image Details
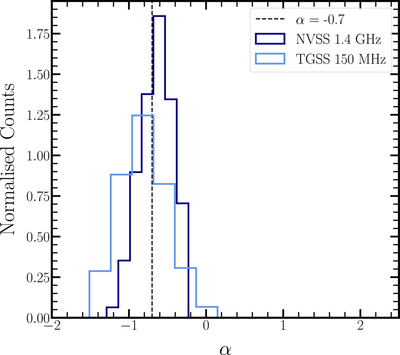
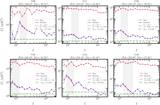
Caption: Figure 6.
The normalized distribution of spectral indices derived from cross-matching with the 1.4 GHz VLA-NVSS (navy) and 150 MHz uGMRT-TGSS (royal blue) surveys is shown as solid lines, using a matching radius of 20″. The assumed power-law spectral index of α = −0.7 is indicated by a dashed line in black.
Other Images in This Article
Copyright and Terms & Conditions
© 2026. The Author(s). Published by the American Astronomical Society.

Copyright ©
2026 Astronomy Image Explorer. All Rights Reserved.
