

Image Details
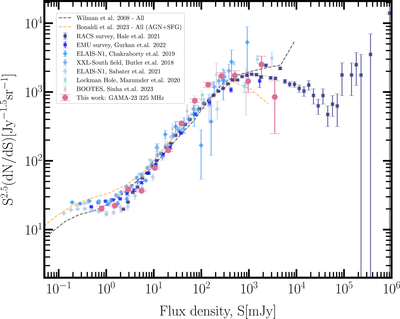
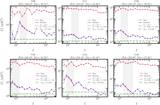
Caption: Figure 8.
The Euclidean-normalized differential source counts at 325 MHz for the GAMA-23 field (pink circles) are shown after applying FDR and incompleteness corrections. Model predictions from the S3-SKADS (R. J. Wilman et al. 2008) and T-RECS II (A. Bonaldi et al. 2023) simulations are indicated as black and orange dashed lines, respectively. The results are also compared with other observational datasets covering the same sky region, such as ASKAP RACS survey at 887.5 MHz (C. L. Hale et al. 2021) (navy squares), and EMU (GAMA-23) survey 887.5 MHz (G. Gürkan et al. 2022) (blue squares). Comparisons with other fields include ELAIS-N1—400 MHz uGMRT (A. Chakraborty et al. 2019b) (dodger-blue diamonds), LoTSS 150 MHz LOFAR (S. Mandal et al. 2021) (light steel blue diamonds), XXL−South field 2.1 GHz ATCA (A. Butler et al. 2018) (cornflower-blue diamonds), Lockman Hole 325 MHz GMRT (A. Mazumder et al. 2020) (skyblue crosses), and Boötes 400 MHz uGMRT (A. Sinha & A. Datta 2023) (silver triangles).
Other Images in This Article
Copyright and Terms & Conditions
© 2026. The Author(s). Published by the American Astronomical Society.

