

Image Details
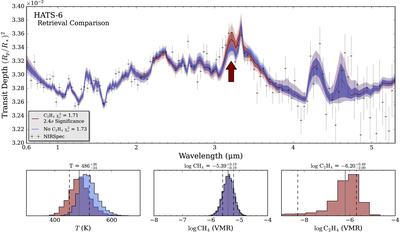
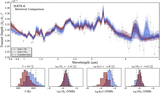
Caption: Figure 13.
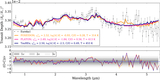
Comparisons between models with and without C2H4, and the resulting retrieved values for methane and Teq for the Eureka1 reductions. The significance noted is derived from the Bayesian evidence of each model. The presence of C2H4 drives the Teq further down from the expected Teq. We find a slight constraint on C2H4 at VMR abundances of ∼10−6.20 and a slightly lower ﹩{\chi }_{\nu }^{2}﹩ value of 1.71 in comparison to our model without C2H4 (﹩{\chi }_{\nu }^{2}﹩ = 1.73). We note the evidence for this feature is more significant in visit 2 than visit 1. For reference, Figure J2 shows the individual spectral contribution of C2H4 to the model shown above, and the arrow in the plot above highlights the region of strongest contribution from C2H4.
Other Images in This Article
Show More
Copyright and Terms & Conditions
© 2026. The Author(s). Published by the American Astronomical Society.

