

Image Details
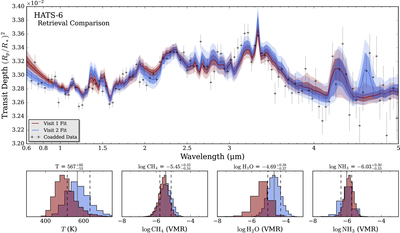
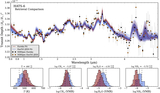
Caption: Figure 8.
Comparison of best-model fits per visit as well as posteriors for the most robustly detected species for our final POSEIDON model M2.5 (clouds + haze). Note that the visit-by-visit retrievals were performed at pixel-level resolution (Section 3.5), but are plotted here against the coadded Eureka1 spectra for easier visualization. For reference, Figure J1 shows the individual spectral contribution of each molecular species to the final model shown above.
Other Images in This Article
Show More
Copyright and Terms & Conditions
© 2026. The Author(s). Published by the American Astronomical Society.

Copyright ©
2026 Astronomy Image Explorer. All Rights Reserved.
