

Image Details
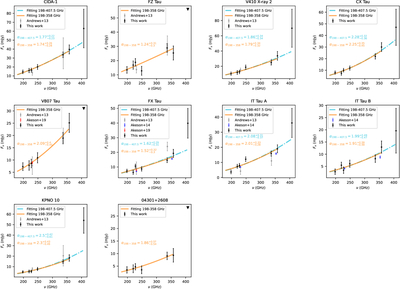
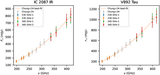
Caption: Figure 2.
Flux densities of the selected Class II disks in the Taurus-Auriga region. The vertical error bars are ±1σ uncertainties. Upside-down triangles show 3σ upper limits.
Other Images in This Article
Copyright and Terms & Conditions
© 2026. The Author(s). Published by the American Astronomical Society.

Copyright ©
2026 Astronomy Image Explorer. All Rights Reserved.
