

Image Details
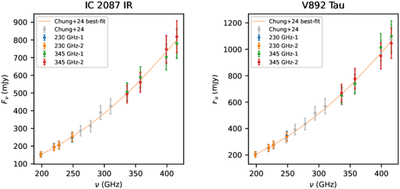
Caption: Figure 5.
Flux densities of the two calibration sources, IC 2087 IR and V892 Tau. Color symbols show the measurements from the new SMA observations introduced in Section 2, after rescaling based on the procedure outlined in Section 3.3; gray symbols and solid lines show the measurements quoted from C.-Y. Chung et al. (2024) and the best-fit power laws for the quoted measurements.
Other Images in This Article
Copyright and Terms & Conditions
© 2026. The Author(s). Published by the American Astronomical Society.

Copyright ©
2026 Astronomy Image Explorer. All Rights Reserved.
