

Image Details
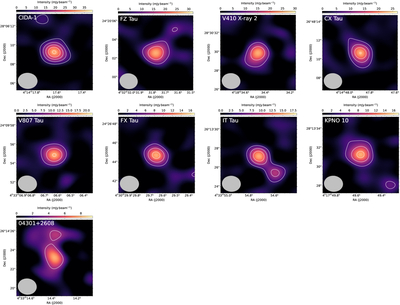
Caption: Figure 1.
Images of the selected sources (Table 1) at 347 GHz. Each panel shows the 8″-wide square region centered at the peak of the target source. The IT Tau panel covers the brighter source IT Tau A and the fainter companion IT Tau B southwest of it. Contours start at 3σ, with 3σ intervals. For the sake of revealing the original observational results, when producing these images, we did not apply the additional multiplicative absolute flux calibration factors introduced in Section 3.3.
Other Images in This Article
Copyright and Terms & Conditions
© 2026. The Author(s). Published by the American Astronomical Society.

Copyright ©
2026 Astronomy Image Explorer. All Rights Reserved.
