

Image Details
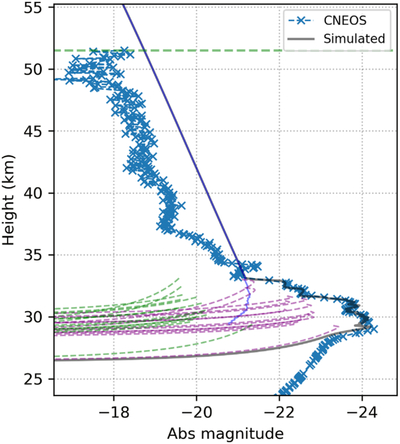
Caption: Figure 7.
Modeled light curve of the Queensland superbolide. The CNEOS-observed absolute magnitude profile (blue crosses) is compared with the simulated composite light curve (gray solid line). Dashed curves show the contributions of individual fragments and debris clouds. The diagonal blue line indicates the prefragmentation single-body trajectory. The horizontal dashed green line marks the altitude of the light-curve start.
Other Images in This Article
Show More
Copyright and Terms & Conditions
© 2026. The Author(s). Published by the American Astronomical Society.

Copyright ©
2026 Astronomy Image Explorer. All Rights Reserved.
