

Image Details
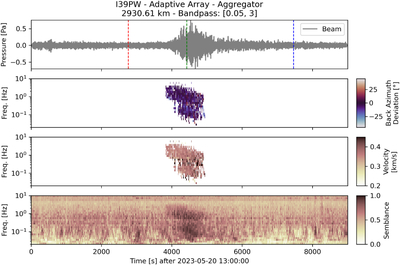
Caption: Figure 5.
Cardinal output for station I39PW. The panels provide an analysis of the signal’s characteristics over time. The vertical dashed lines (red, green, and blue) represent theoretical or predicted arrival windows based on different atmospheric propagation waveguides. Panels from top to bottom represent timeseries (the bandpass-filtered—0.05–3 Hz—waveform, showing a high-amplitude arrival between 4000 and 5000 s); back azimuth deviation (the consistency of the signal’s arrival direction; the focused cluster indicates a coherent point source); trace velocity; and semblance (a correlation metric where higher values—darker regions—identify the arrival of a coherent, nonrandom signal).
Other Images in This Article
Show More
Copyright and Terms & Conditions
© 2026. The Author(s). Published by the American Astronomical Society.

