

Image Details
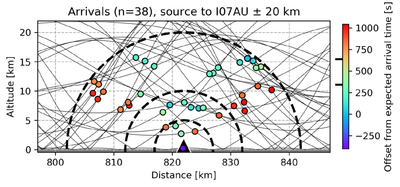
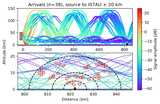
Caption: Figure B2.
Ray paths containing arrivals shown as a function of distance and altitude, with circles marking individual arrivals. Color indicates the arrival time residual relative to the predicted arrival assuming a celerity of 285 m s−1. Heavy black ticks on the left side of the colorbar denote the observed signal window
Other Images in This Article
Show More
Copyright and Terms & Conditions
© 2026. The Author(s). Published by the American Astronomical Society.

Copyright ©
2026 Astronomy Image Explorer. All Rights Reserved.
