

Image Details
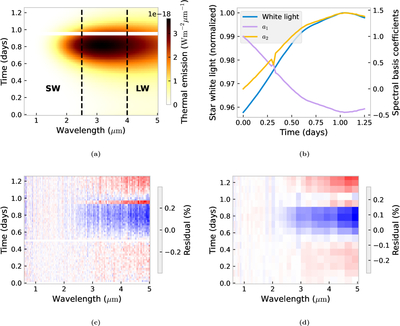
Caption: Figure 4.
PIE phase curve and VPIE analysis of the warm giant planet TOI-519 b. (a) Thermal emission phase curve with Tnight/Tday = 0.5 over one orbit in the spectral range 0.6–5 μm. (b) Fit to the stellar variability. Left axis (blue line) shows the normalized white light curve of the star over the observation. The right axis shows the best-fit coefficients of the basis spectra (ak in Equation (2)). (c) VPIE residual pattern. This is the signal that can be matched with a model to infer planetary properties. (d) Binned VPIE residual pattern. Same as (c), but binned by 6 pixels in wavelength and 4 pixels in time in order to remove correlated noise✎.
Other Images in This Article
Copyright and Terms & Conditions
© 2026. The Author(s). Published by the American Astronomical Society.

