

Image Details
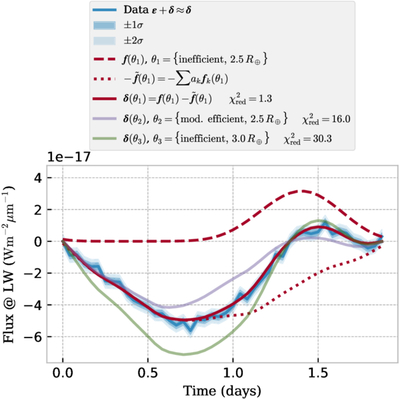
Caption: Figure 3.
Example of planetary properties inference with one-dimensional data. The properties of the planet in the simulated observation (blue with shading) can be inferred by comparing to various forward models. The red dashed line is a phase-curve model with input parameters θ1. As an intermediate step, we show the phase-curve reconstruction (﹩-\tilde{f}﹩), which traces stellar activity; this is the dotted line. Note that we multiplied by a factor of −1 so that it may be added to the dashed line by eye. The sum of the dashed and dotted lines is the planet model’s residual signal (δ(θ1), solid red line). Residual signals for two additional models (θ2, θ3) are also shown. Each residual is compared to the data using the ﹩{\chi }_{{\rm{red}}}^{2}﹩ metric, and as a result we may infer that the data support a planet with properties similar to θ1✎.
Other Images in This Article
Copyright and Terms & Conditions
© 2026. The Author(s). Published by the American Astronomical Society.

