

Image Details
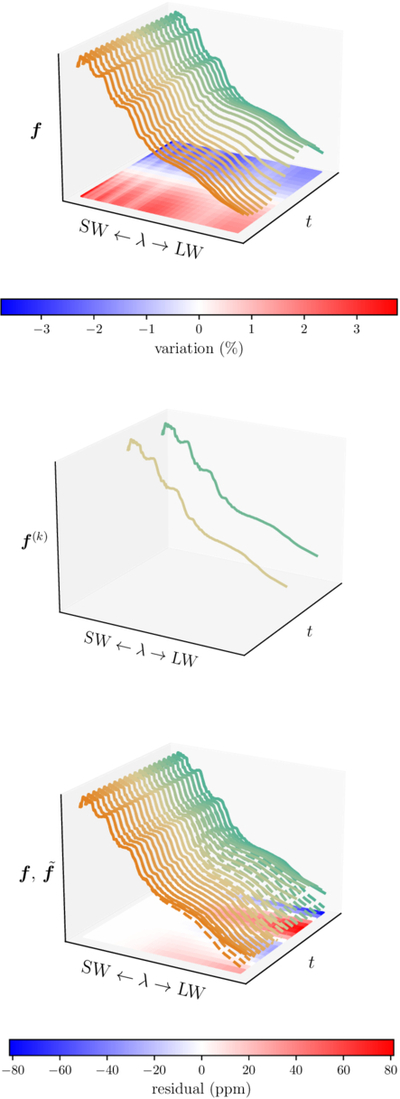
Caption: Figure 2.
Basis spectra reconstruction. Top: spectral time series comprising a VPIE observation. The planetary spectrum has been multiplied by 104 for visibility; the sinusoidal shape of the variability caused by the planet can be clearly seen in the LW portion of the spectrum. The SW stellar spectrum also varies with time; the red-blue image on the x–y plane shows variations from the mean spectrum. Middle: best basis for the dataset shown in the top panel, found by minimizing the BIC. Bottom: reconstruction of the dataset shown in the top panel using only the basis spectra (dashed lines), plotted along with the original data (solid lines). Note that solid and dashed lines converge in the SW portion of the spectrum, but in the LW region the spectra are significantly different; this is because the fitting procedure was not given any information about the time-series behavior of the planet. The planet’s imprint on the residuals is shown in red and blue on the x–y plane; note the difference in the color bar scales✎.
Other Images in This Article
Copyright and Terms & Conditions
© 2026. The Author(s). Published by the American Astronomical Society.

