

Image Details
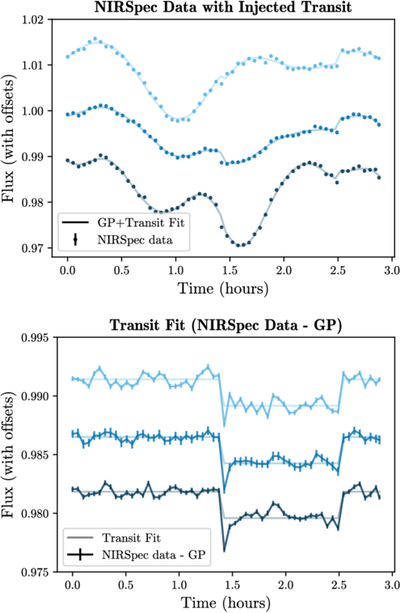
Caption: Figure 5.
NIRSpec light curves corresponding to grouping in Figure 2 with a 3000 ppm (0.75 R⊕) injected transit. The top panel displays the temporally binned light curve with GP fit plus the injected transit and its fit. The bottom panel subtracts the GP fit and displays the transit fit. The offsets between the two panels are unrelated and were chosen to reflect the data with the most visual detail.
Other Images in This Article
Copyright and Terms & Conditions
© 2026. The Author(s). Published by the American Astronomical Society.

Copyright ©
2026 Astronomy Image Explorer. All Rights Reserved.
