

Image Details
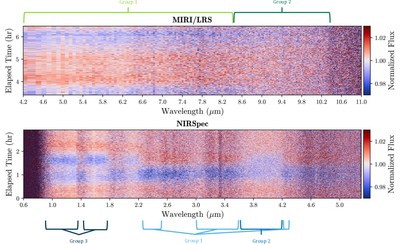
Caption: Figure 1.
Unbinned spectrophotometric MIRI (top) and NIRSpec (bottom) data for SIMP 0136+0933. Multiple variability patterns are distinguishable by eye, particularly in the NIRSpec data. The wavelength grouping is used to build the light curves shown in Figure 2 (grouping is approximate and displayed for visual purposes only).
Other Images in This Article
Copyright and Terms & Conditions
© 2026. The Author(s). Published by the American Astronomical Society.

Copyright ©
2026 Astronomy Image Explorer. All Rights Reserved.
