

Image Details
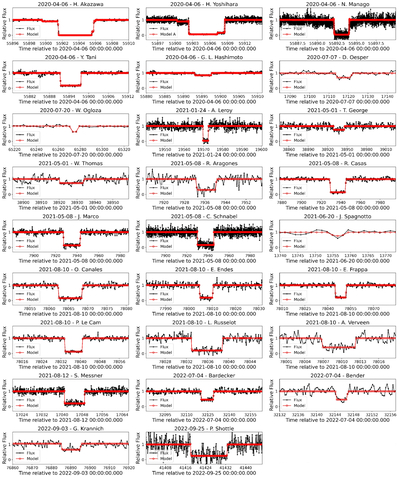
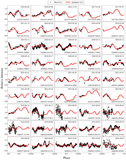
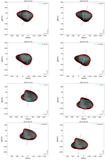
Caption: Figure 7.
Light curves of positive detections from occultations by Paris observed between 2020 and 2022. The black line represents the observed data, while the red line corresponds to the modeled light curve.
Other Images in This Article
Copyright and Terms & Conditions
© 2026. The Author(s). Published by the American Astronomical Society.

Copyright ©
2026 Astronomy Image Explorer. All Rights Reserved.
