

Image Details
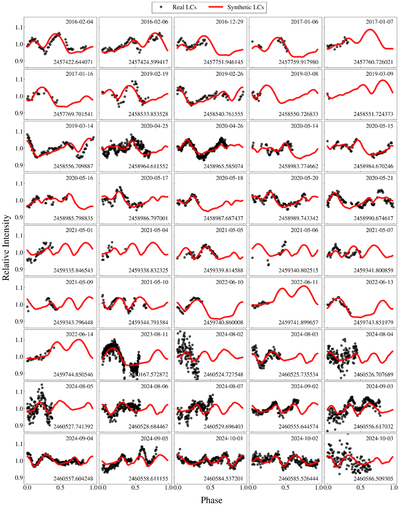
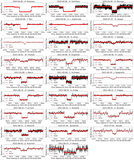
Caption: Figure 5.
RLCs of Paris used in the modeling. Black dots: observed relative flux. Red crosses: synthetic light curves derived from the E. Gradovski et al. (2026) approach, compared directly with observations and extrapolated to regions without data.
Other Images in This Article
Copyright and Terms & Conditions
© 2026. The Author(s). Published by the American Astronomical Society.

Copyright ©
2026 Astronomy Image Explorer. All Rights Reserved.
