

Image Details
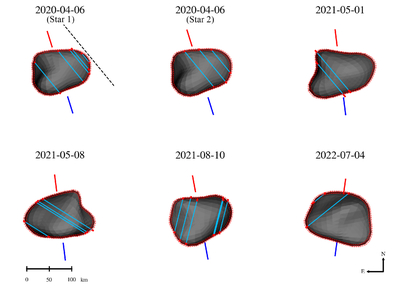
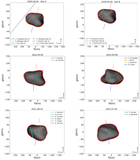
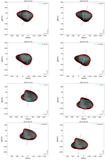
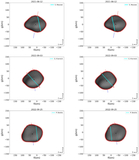
Caption: Figure 4.
Fit of the 3D shape model of Paris to the stellar occultation data. Cyan lines represent positive chords, with red segments indicating their uncertainty regions. The dashed black line corresponds to a near-limb negative chord. Dashed red contours around the limb denote the model error at ±1σ (in kilometers). Red and blue lines extending outside the shape illustrate the orientation of the spin axis.
Other Images in This Article
Copyright and Terms & Conditions
© 2026. The Author(s). Published by the American Astronomical Society.

Copyright ©
2026 Astronomy Image Explorer. All Rights Reserved.
