

Image Details
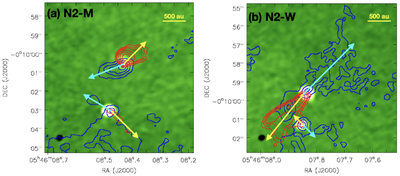
Caption: Figure 2.
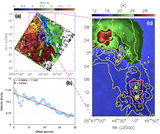
Molecular CO outflows are shown in contours, and 1.3 mm continuum is shown in color image. Red and blue contours represent redshifted (from 15 to 35 km s−1) emission and blueshifted (from −15 to 5 km s−1) emission, respectively. Contour levels are [1, 2, 3, 4, 5] × 0.1 Jy beam−1 km s−1 for blueshifted emission and [1, 1.5, 2, 3, 4, 5] × 0.1 Jy beam−1 km s−1 for redshifted emission. Arrows mark outflow directions determined by visual identification.
Other Images in This Article
Copyright and Terms & Conditions
© 2026. The Author(s). Published by the American Astronomical Society.

Copyright ©
2026 Astronomy Image Explorer. All Rights Reserved.
