

Image Details
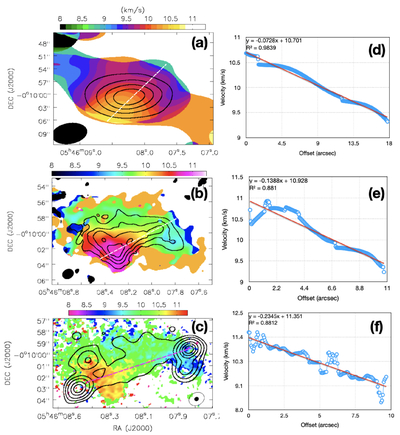
Caption: Figure D1.
(a) Moment 1 map of H2CO line emission from ACA observations shown in color. The corresponding integrated intensity map is shown in contours. Contour levels are [0.2, 0.4, 0.6, 0.8] × 7.97 Jy beam−1 km s−1. (b) Moment 1 map of H2CO line emission from ACA+TM2 observations shown in color. Contours show the integrated intensity map. Contour levels are [0.2, 0.4, 0.6, 0.8] × 0.398 Jy beam−1 km s−1. (c) Moment 1 map of H2CO line emission from ACA+TM2+TM1 observations shown in color. Contours show the 1.3 mm continuum emission. Contour levels are [0.05, 0.1, 0.2, 0.4, 0.6, 0.8] × 42.7 mJy beam−1. Panels (d), (e), and (f) show the velocity profiles along the dashed lines in the corresponding left panels. Red lines indicate linear fits.
Other Images in This Article
Copyright and Terms & Conditions
© 2026. The Author(s). Published by the American Astronomical Society.

