

Image Details
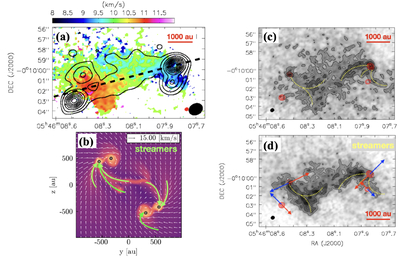
Caption: Figure 4.
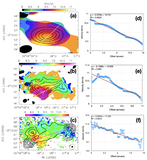
(a) The mirror-symmetric twin binary protostellar systems. Color image shows the velocity field of H2CO line emission. Contours show the 1.3 mm continuum emission obtained from ACA+TM2 data. Contour levels are [0.05, 0.06, 0.07, 0.08, 0.09, 0.1, 0.2, 0.4, 0.6, 0.8] × 42.7 mJy beam−1. The elongated bar-like structure is outlined by the dashed line. (b) Column density of a fragmented dense core in the purely hydrodynamical model (R. Mignon-Risse et al. 2023). White dots indicate sink particle positions. Gas velocity vectors are overplotted. This figure is adapted from R. Mignon-Risse et al. (2023) with permission from the author. (c) The gray image and black contours show the integrated intensity map of C18O (2–1) from 6 to 14 km s−1. Contour levels are [0.4, 0.6, 0.8] × 0.203 Jy beam−1 km s−1. (d) The gray image and black contours show the integrated intensity map of H2CO 3(0,3)–2(0,2) from 8 to 12 km s−1. Contour levels are [0.4, 0.6, 0.8] × 0.1245 Jy beam−1 km s−1. Blue and red arrows indicate the directions of CO outflows. Yellow dashed lines in panels (c) and (d) mark the streamer-like gas structures, and red contours show the 1.3 mm continuum from combined ACA and ALMA data with an angular resolution of ﹩\sim 0\mathop{.}\limits{^{\prime\prime} }35﹩. Contour levels are [0.05, 0.1, 0.2, 0.4, 0.6, 0.8] × 0.0307 Jy beam−1.
Other Images in This Article
Copyright and Terms & Conditions
© 2026. The Author(s). Published by the American Astronomical Society.

