

Image Details
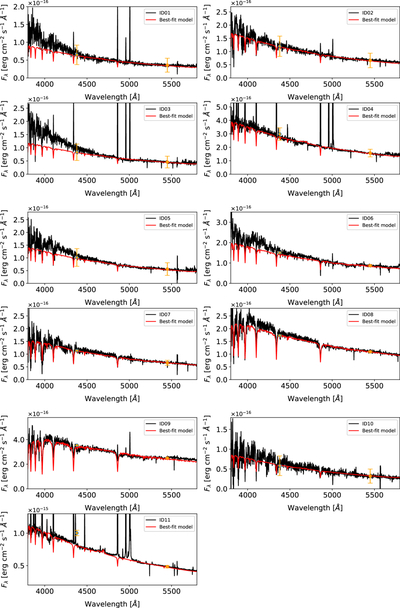
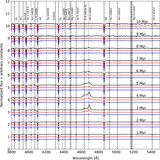
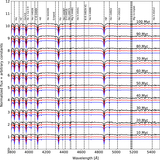
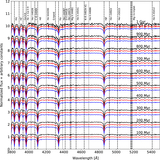
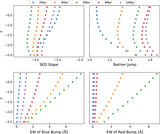
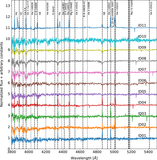
Caption: Figure 7.
Comparison between the observed spectra (black curves) and the best-matched synthetic spectra (red curves). Note that only the mean Galactic extinction was applied to the synthetic templates. The B- and V-band mean fluxes predicted by our Monte Carlo simulations are indicated by orange symbols, with the corresponding 1σ uncertainties denoted by error bars.
Other Images in This Article
Show More
Copyright and Terms & Conditions
© 2026. The Author(s). Published by the American Astronomical Society.

Copyright ©
2026 Astronomy Image Explorer. All Rights Reserved.
