

Image Details
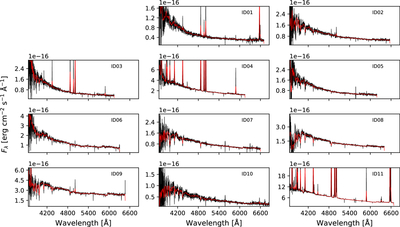
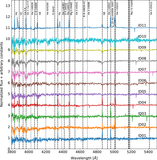
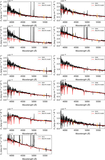
Caption: Figure 2.
Flux-calibrated spectra of 11 clusters. The IDs of individual clusters are labeled in the upper right corner of each panel. The red curves represent the smoothed spectra to highlight spectral features.
Other Images in This Article
Show More
Copyright and Terms & Conditions
© 2026. The Author(s). Published by the American Astronomical Society.

Copyright ©
2026 Astronomy Image Explorer. All Rights Reserved.
