

Image Details
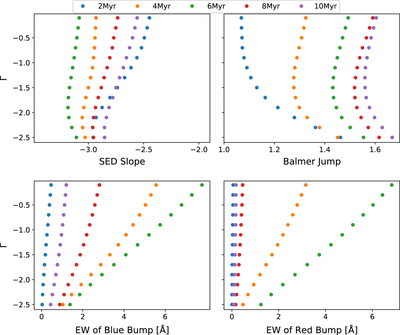
Caption: Figure 5.
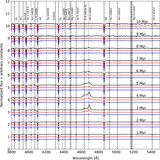
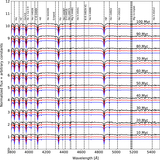
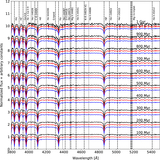
Variations of spectral features obtained from the synthetic integrated spectra of model clusters (Mcl = 106 M⊙ and Z = 0.008). In the bottom panels, the equivalent widths of blue and red bumps are obtained from the output of Starburst99, N III λ4640 + C III λ4650 + He II λ4686 and C IV λ5808, respectively.
Other Images in This Article
Show More
Copyright and Terms & Conditions
© 2026. The Author(s). Published by the American Astronomical Society.

Copyright ©
2026 Astronomy Image Explorer. All Rights Reserved.
