

Image Details
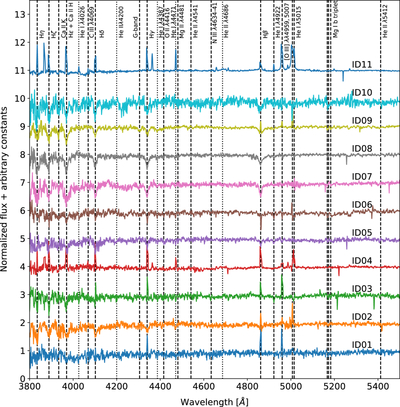
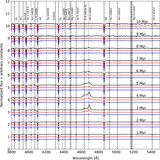
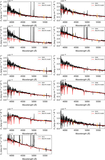
Caption: Figure 6.
Normalized spectra of the observed clusters. To minimize spectral overlap, the intensities of strong emission lines (exceeding two times the normalized continuum) are deliberately limited. The IDs of the individual clusters are labeled in the upper right corner of each spectrum. The spectral lines shown in Figure 4 are displayed with vertical lines.
Other Images in This Article
Show More
Copyright and Terms & Conditions
© 2026. The Author(s). Published by the American Astronomical Society.

Copyright ©
2026 Astronomy Image Explorer. All Rights Reserved.
