Image Details
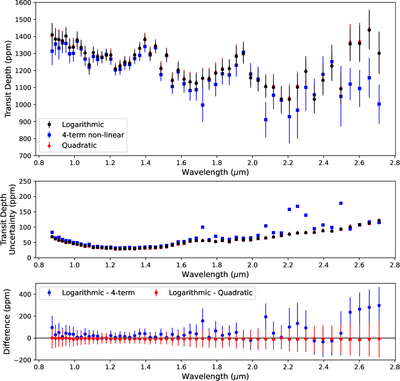
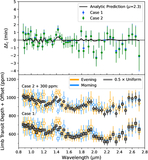
Caption: Figure 11.
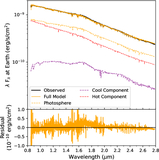
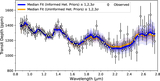
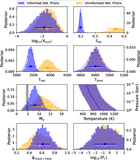
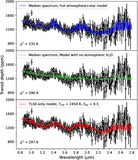
Top: the transmission spectrum of V1298 Tau c, at a resolution R = 50, derived assuming three different limb darkening profiles when fitting the spectroscopic light curves, and enforcing only uniform priors on the coefficients. In each case, we mask all starspot crossing features seen in the light curve. Middle: the fitted transit depth uncertainties from each case. Bottom: the difference in transit depths between the three cases. The error bars represent the mutual propagated uncertainty on the difference. ✎
Other Images in This Article
Show More
Copyright and Terms & Conditions
© 2026. The Author(s). Published by the American Astronomical Society.
Copyright ©
2026 Astronomy Image Explorer. All Rights Reserved.