Image Details
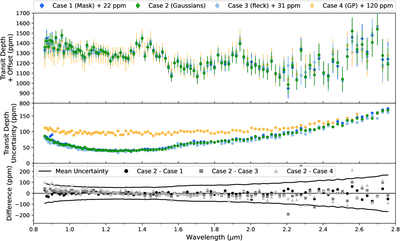
Caption: Figure 3.
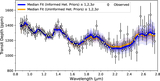
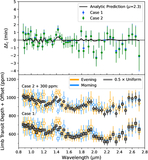
The results of four independent methodologies for handling SCEs during a transit of V1298 Tau c observed with JWST/NIRISS/SOSS. Top: the ∼0.8–2.8 μm transmission spectra of V1298 Tau c at a resolution of R = 100. The color corresponds to the fitting routine used (see Sections 3.2–3.5). The spectra are manually offset by 21 ppm for Case 1, 20 ppm for Case 3, and 120 ppm for Case 4 to have the same median transit depth for visual comparison. Middle: the transit depth uncertainties achieved in each method. Bottom: the chromatic difference between each case including offsets to highlight the relative shape of each result. The solid lines represent the mean transit depth uncertainty between each case. This figure highlights that regardless of how the observed SCEs are masked or fit, the resulting transmission spectrum has the same overall shape and absorption features. ✎
Other Images in This Article
Show More
Copyright and Terms & Conditions
© 2026. The Author(s). Published by the American Astronomical Society.