Image Details
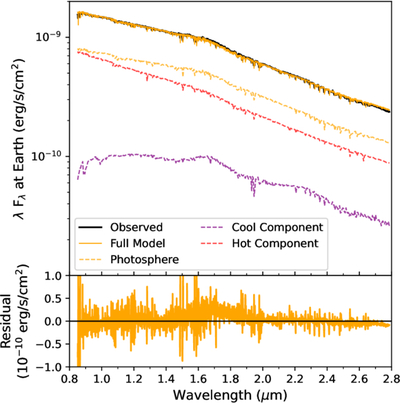
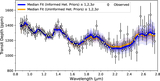
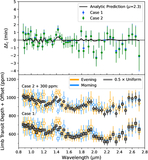
Caption: Figure 4.
The 0.8–2.8 μm spectrum of V1298 Tau. Top: comparing the observed spectrum to the best-fit three-component model, and the individual components scaled by their respective covering fractions. Bottom: the corresponding data – model residuals. NIRISS/SOSS is flux calibrated to the ∼1% level according to the JWST User Documentation, which is on the order of the magnitude of our residuals relative to the spectrum (≲5%). ✎
Other Images in This Article
Show More
Copyright and Terms & Conditions
© 2026. The Author(s). Published by the American Astronomical Society.
Copyright ©
2026 Astronomy Image Explorer. All Rights Reserved.