Image Details
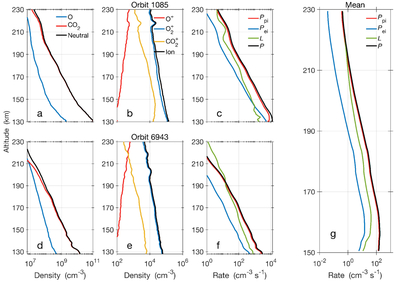
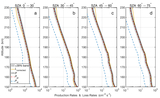
Caption: Figure 2.
Neutral and ion densities derived from NGIMS on board MAVEN, together with the corresponding ion production and destruction rates. Panels (a)–(c) and (d)–(f) show measurements from the inbound segments of orbits 1085 and 6943, respectively. For each orbit, the left panel presents neutral density profiles, the middle panel shows ion density profiles, and the right panel displays ion production and destruction rates as functions of altitude. The profiles labeled Ppi and Pei denote photoionization and electron impact ionization rates, respectively, while P represents the total ion production rate, defined as the sum of Ppi and Pei. The ion destruction rate L is calculated from DR. Panel (g) shows the average profiles obtained by combining all available measurements from 2014 October to 2019 August.
Other Images in This Article
Copyright and Terms & Conditions
© 2026. The Author(s). Published by the American Astronomical Society.