Image Details
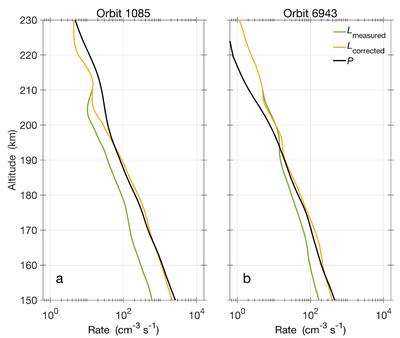
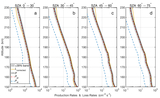
Caption: Figure 4.
Comparison between ion production and destruction rates after applying the empirical electron temperature correction for orbits (a) No. 1085, an in-sample profile, and (b) No. 6943, an out-of-sample profile. The ion production rate (P), ion destruction rates calculated using the original LPW electron temperature (Lmeasured), and the empirically corrected electron temperature (Lcorrected) are shown as black, green, and yellow solid lines, respectively.
Other Images in This Article
Copyright and Terms & Conditions
© 2026. The Author(s). Published by the American Astronomical Society.
Copyright ©
2026 Astronomy Image Explorer. All Rights Reserved.