Image Details
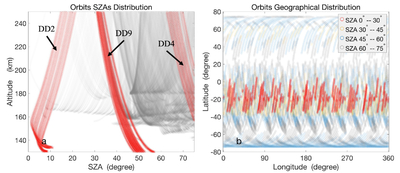
Caption: Figure 1.
MAVEN orbit distribution with altitude and SZA (panel (a)) and latitude and longitude (panel (b)) from October 2014 to August 2019. Arrows with the “DD” tag in panel (a) represent Deep Dip campaigns, the orbits of which are shown as red crosses, and the remaining observations are shown as gray crosses. Panel (b) shows the geographic distribution of the observations, where red, yellow, blue, and gray circles denote measurements obtained at SZAs of 0∘–30∘, 30∘–45∘, 45∘–60∘, and 60∘–75∘.
Other Images in This Article
Copyright and Terms & Conditions
© 2026. The Author(s). Published by the American Astronomical Society.
Copyright ©
2026 Astronomy Image Explorer. All Rights Reserved.