Image Details
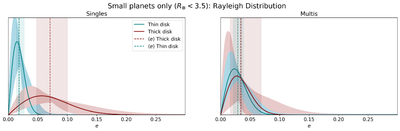
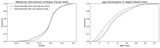
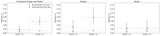
Caption: Figure 8.
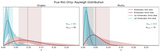
Left: 〈e〉 for thick- versus thin-disk small planet hosts with Rp < 3.5R⊕. Singles are shown on the left panel, with multis on the right panel. 〈e〉 is calculated from the underlying eccentricity distribution for each subsample modeled as Rayleigh distributions. The vertical error bars represent the 1σ〈e〉 uncertainties.
Other Images in This Article
Copyright and Terms & Conditions
© 2026. The Author(s). Published by the American Astronomical Society.
Copyright ©
2026 Astronomy Image Explorer. All Rights Reserved.