Image Details
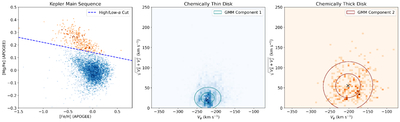
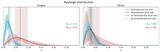
Caption: Figure 1.
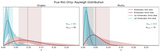
Left: magnesium [Mg/Fe] versus iron [Fe/H] abundances from ASPCAP for the calibration sample of Kepler/APOGEE main-sequence stars. The high-α/low-α linear cutoff is shown with the blue dotted line. The green heatmap represents the low-α (thin-disk) calibration sample, and the red heatmap represents the high-α (thick-disk) calibration sample. Center: the thin-disk calibration sample in Vϕ versus ﹩\sqrt{{V}_{r}^{2}+{V}_{z}^{2}}﹩ velocity space. The mean of the low-α component of the GMM is designated with a cross, and the concentric circles represent the 1σ and 2σ regions. Right: same as the center, but for the high-α calibration sample.
Other Images in This Article
Copyright and Terms & Conditions
© 2026. The Author(s). Published by the American Astronomical Society.