Image Details
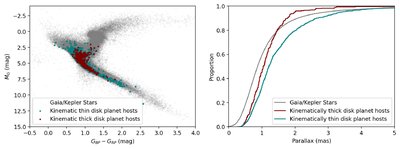
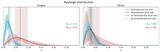
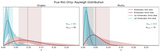
Caption: Figure 3.
Left: color–magnitude diagram of the KIC sample (gray), the sample of kinematic thin-disk planet hosts (teal), and the sample of kinematic thick-disk planet hosts (red). The absolute magnitude MG and color GBP − GRP are calculated with Gaia DR3 data. Right: parallax distributions for the entire KIC sample, kinematic thin-disk, and kinematic thick-disk planet hosts.
Other Images in This Article
Copyright and Terms & Conditions
© 2026. The Author(s). Published by the American Astronomical Society.
Copyright ©
2026 Astronomy Image Explorer. All Rights Reserved.