Image Details
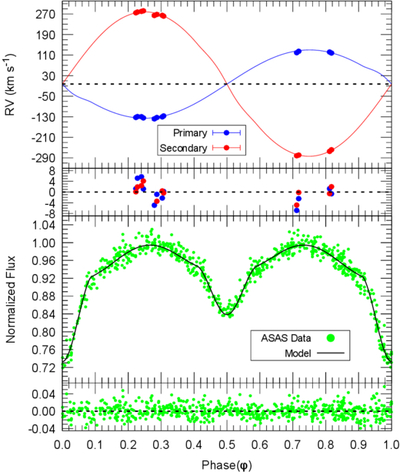
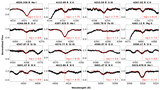
Caption: Figure 3.
Observed RVs and photometric LCs of ET Cru, together with the best-fitting models and corresponding residuals. The blue and red filled circles indicate the RV measurements of the primary and secondary components, respectively. In the LC panel, green dots show the ASAS photometric data, and the black curve represents the best-fitting LC solution.
Other Images in This Article
Show More
Copyright and Terms & Conditions
© 2026. The Author(s). Published by the American Astronomical Society.
Copyright ©
2026 Astronomy Image Explorer. All Rights Reserved.