Image Details
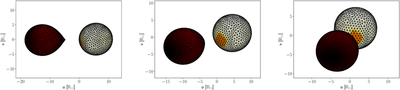
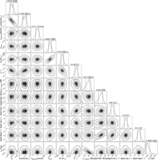
Caption: Figure 6.
Mesh plots of the binary system ET Cru at orbital phases 0.75 (left), 0.85 (middle), and 0.95 (right), generated with PHOEBE v2.4. The color scale represents the local effective temperature across each stellar surface, while the mesh structure traces the distorted Roche–lobe-filling components. The sequence illustrates the changing aspect of the system as it approaches secondary eclipse (phase 0.75) and moves toward the quadrature (phase 0.85) and preeclipse (phase 0.95) configurations.
Other Images in This Article
Show More
Copyright and Terms & Conditions
© 2026. The Author(s). Published by the American Astronomical Society.
Copyright ©
2026 Astronomy Image Explorer. All Rights Reserved.