Image Details
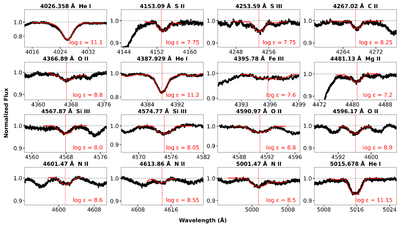
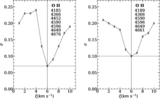
Caption: Figure 10.
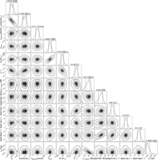
Selected line profile fits for the ET Cru primary component from FEROS spectra. Observed spectra are shown as black dots, with the best-fit synthetic spectra overlaid in red. The dashed horizontal line indicates the continuum level. The derived logarithmic abundance (logϵ) for each species is indicated in the corresponding panel.
Other Images in This Article
Show More
Copyright and Terms & Conditions
© 2026. The Author(s). Published by the American Astronomical Society.
Copyright ©
2026 Astronomy Image Explorer. All Rights Reserved.