Image Details
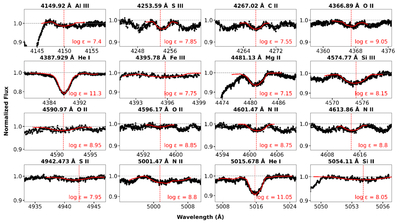
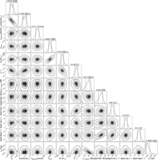
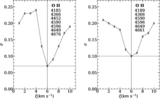
Caption: Figure 11.
Same as Figure 10, but for the secondary component. Line profiles are shown for Al III (λ4149.92 Å), S III (λ4253.59 Å), C II (λ4267.02 Å), O II (λ4366.89, 4590.97, 4596.17 Å), He I (λ4387.929, 5015.678 Å), Fe III (λ4395.78 Å), Mg II (λ4481.13 Å), Si III (λ4574.77 Å), N II (λ4601.47, 4613.86, 5001.47 Å), and S II (λ4942.473 Å). The derived logarithmic abundance (﹩\mathrm{log}\epsilon ﹩) for each species is indicated in the corresponding panels.
Other Images in This Article
Show More
Copyright and Terms & Conditions
© 2026. The Author(s). Published by the American Astronomical Society.
Copyright ©
2026 Astronomy Image Explorer. All Rights Reserved.