Image Details
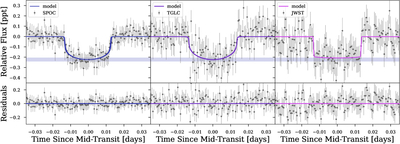
Caption: Figure 1.
From left to right: SPOC PDCSAP, TGLC, and JWST photometry. Top: binned (30 s) and phase-folded light curve of GJ 367 confirming the transit signal of GJ 367 b (gray points). The best-fit transit model corresponding to each dataset (see Section 3.2) is overplotted. The blue shaded region in each panel is the adopted transit depth and 1σ uncertainty from the SPOC photometry fit, showing that the transit depths are consistent. Bottom: cata minus model residuals.
Other Images in This Article
Copyright and Terms & Conditions
© 2026. The Author(s). Published by the American Astronomical Society.
Copyright ©
2026 Astronomy Image Explorer. All Rights Reserved.