Image Details
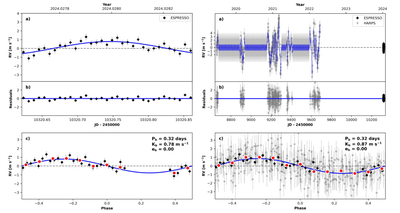
Caption: Figure 2.
Radial velocity (RV) variation of GJ 367 observed with (left) ESPRESSO (black diamonds) and (right) ESPRESSO + HARPS (gray circles). For both the left and right plots, panel (a) shows the time-series RV measurements. The best-fit radvel Gaussian process (GP) single-Keplerian model for the ESPRESSO + HARPS combined dataset (gray line) used to remove stellar and instrumental correlated noise (see Section 4) is shown on the right side. The best-fit Keplerian orbital solution (blue line) is shown in each side. Panel (b) shows the fit residuals (data—model). Panel (c) shows the RV variations of GJ 367 as a function of orbital phase. The red points represent RVs binned to 10% of Porb.
Other Images in This Article
Copyright and Terms & Conditions
© 2026. The Author(s). Published by the American Astronomical Society.