Image Details
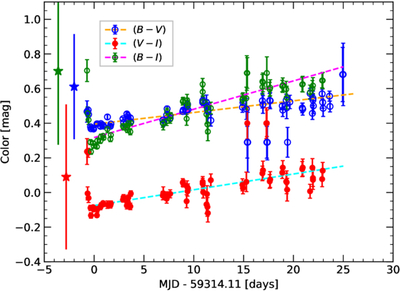
Caption: Figure 6.
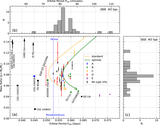
Color evolution of KSP-OT-202104a: blue, red, and green circles for (B − V), (V − I), and (B − I) colors without extinction correction. The x-axis represents days from the V-band peak brightness at MJD = 59314.11. The stars with large error bars in the left are colors for the quiescent phase shown for comparison, and the dashed lines show the results of linear fittings of the post-peak-color evolution.
Other Images in This Article
Copyright and Terms & Conditions
© 2026. The Author(s). Published by the American Astronomical Society.
Copyright ©
2026 Astronomy Image Explorer. All Rights Reserved.