Image Details
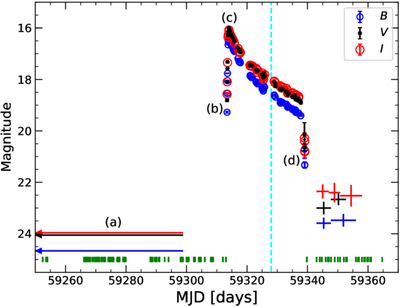
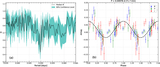
Caption: Figure 1.
BVI-band light curves of the superoutburst of KSP-OT-202104a with no extinction correction. The cyan dashed vertical line marks the epoch when the Gemini spectrum was taken, and the short green vertical lines at the bottom correspond to the epochs outside the outburst when our V-band observations were made. Labels (a)–(d) denote different phases: (a) quiescent phase prior to the superoutburst in MJD = 58795.27–59298.86; (b) epoch for the first detection at MJD = 59313.40; (c) epoch near the peak at MJD = 59314.01; and (d) epoch of the last detection at MJD = 59339.05. The labels (a)–(d) coincide with those in the images shown in Figure 4. The horizontal bars with arrows represent the quiescent magnitudes of the source: B = 24.67 ± 0.22, V = 24.05 ± 0.21, and I = 23.96 ± 0.36 mag. The seven plus symbols near the right bottom corner are brightnesses of the source in MJD = 59342–59359 during its tail part obtained by stacking images (see text for details).
Other Images in This Article
Copyright and Terms & Conditions
© 2026. The Author(s). Published by the American Astronomical Society.