Image Details
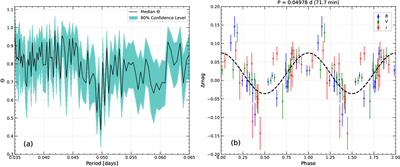
Caption: Figure 5.
(a) Results of PDM analysis and (b) phase-folded profile. In panel (a), the black solid line is median Θ and the shaded area presents 90% confidence range from 1,000 bootstrap resampling. In panel (b), blue, green, and red colors indicate B, V, and I band, respectively. The black dashed curve is a sine curve fitted to the data with the period of 71.7 minutes.
Other Images in This Article
Copyright and Terms & Conditions
© 2026. The Author(s). Published by the American Astronomical Society.
Copyright ©
2026 Astronomy Image Explorer. All Rights Reserved.