Image Details
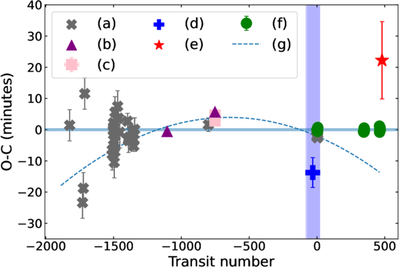
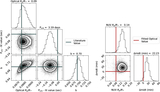
Caption: Figure 5.
Second panel of Figure 2, now incorporating the NUV transit data. The gray points (a) show archival midtransit times reported in E. S. Ivshina & J. N. Winn (2022). The purple (b) and pink (c) points are Spitzer observations from I. Wong et al. (2014) and L. Dang et al. (2022), respectively. The blue point (d) shows the Swift transit observed by L. Corrales et al. (2021), and the vertical blue bar represents the confidence interval from our reanalysis of that dataset. The red point (e) comes from the XMM-Newton OM NUV transit analyzed in this study, and the green points (f) are the TESS transits analyzed in this study. The blue dashed curve (g) is the period-decay model reported by F. Yang & X. Wei (2022). It is evident that the XMM-Newton OM transit does not match the expected optical transit timing, regardless of whether the orbital period is considered to be constant.
Other Images in This Article
Copyright and Terms & Conditions
© 2026. The Author(s). Published by the American Astronomical Society.