Image Details
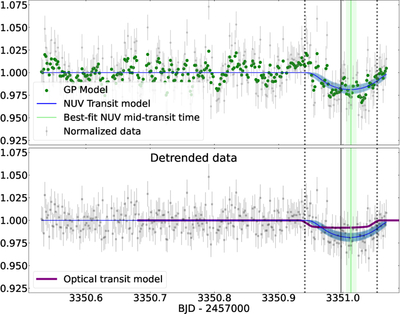
Caption: Figure 3.
Results of our analysis of the XMM-Newton OM data. Top panel: normalized data and the expected duration of the NUV transit, based on the ephemeris fit to the optical TESS data. Bottom panel: detrended data, which is equal to the normalized data divided by the GP model. The bottom panel additionally provides a comparison between a forward-propagated optical transit model and the NUV transit model.
Other Images in This Article
Copyright and Terms & Conditions
© 2026. The Author(s). Published by the American Astronomical Society.
Copyright ©
2026 Astronomy Image Explorer. All Rights Reserved.